Intelligence Hub: AI-Powered Pattern Recognition Across 100+ Companies at Scale
When earnings season hits, a portfolio manager covering 150 companies faces an impossible choice: spend 4 hours analyzing each company in depth (600 hours total—roughly 15 weeks of full-time work compressed into 3-4 weeks), or sacrifice analytical rigor to cover the portfolio superficially.
Traditional research tools—Bloomberg terminals, spreadsheets, even AI chatbots—weren't designed for this reality. Bloomberg excels at single-company deep dives but doesn't scale to portfolio-wide pattern recognition. Spreadsheets track historical data but can't synthesize qualitative insights across dozens of earnings calls. Generic AI chatbots answer one-off questions but lose context across companies, quarters, and analytical threads.
The result: professional investors managing 50-200 company portfolios operate in perpetual triage mode, prioritizing the loudest signals while systematic patterns—competitive shifts, margin trends, management tone changes—slip through the cracks.
Today, we're launching Intelligence Hub—the first AI-native platform built for portfolio-scale pattern recognition. Intelligence Hub enables professional investors to:
- Track 100+ companies simultaneously with AI-powered snapshots capturing temporal evolution across quarters and years
- Execute hundreds of parallel analytical tasks during time-sensitive windows (earnings season, sector rotations, macro events)
- Access 100+ pre-built analytical workflows designed for institutional investment processes (comp analysis, margin decomposition, risk assessment, thematic screening)
This isn't ChatGPT for portfolios. It's a systematic intelligence platform that preserves analytical context across time, companies, and investment themes.
The Problem: Why Portfolio Management Breaks Traditional Research Tools
The Impossible Math of Earnings Season
The Reality Check:
A typical long/short equity fund analyst covers 50-200 companies in their sector. During quarterly earnings season:
- 200+ companies report earnings within a 3-week window
- 4 hours of thorough analysis per company (read 10-Q, listen to earnings call, update model, write memo)
- 800 hours of required work compressed into 15 business days (120 working hours)
The Math Doesn't Work:
Even working 16-hour days, an analyst can only deeply analyze 30 companies before earnings season ends. The remaining 170 companies get superficial coverage or are ignored entirely.
Why Generic AI Tools Fail Portfolio-Scale Research
Problem 1: No Temporal Context Preservation
Generic LLM chatbots (ChatGPT, Claude, Gemini) treat every query as isolated:
- Ask about Apple's Q3 2025 margins → Get an answer
- Ask about Apple's Q2 2025 margins → Get another answer
- Ask "How did Apple's margins evolve Q2→Q3?" → AI retrieves both periods again, recalculates, no historical context preserved
Why This Fails:
Professional investment analysis builds cumulative understanding over quarters and years. An analyst's Q3 2025 analysis incorporates insights from Q2 2025, Q1 2025, and prior year comparisons—context that generic chatbots discard after each conversation.
Problem 2: No Cross-Company Pattern Recognition
Generic AI tools answer questions about one company at a time:
- "What drove Apple's revenue growth?" → Answer
- "What drove Microsoft's revenue growth?" → Answer
- "What revenue growth patterns exist across big tech?" → AI can't synthesize across prior conversations
Why This Fails:
Portfolio managers need comparative insights: Which companies are gaining share? Which are losing pricing power? Which management teams are most credible? Generic chatbots can't maintain cross-company context.
Problem 3: No Parallel Execution at Scale
When 200 companies report earnings in the same week, you need to:
- Extract key metrics from all 200 earnings calls
- Identify sentiment shifts across all management commentaries
- Flag companies with guidance changes
- Surface outliers (positive and negative)
Generic chatbots weren’t built for this workflow: once you’re running dozens of analyses, chat threads become impossible to track, compare, and consolidate.
Why This Fails:
Time-sensitive analysis requires parallel execution—submit 100+ tasks simultaneously, get consolidated results in minutes, not hours.
The Solution: Intelligence Hub for Portfolio-Scale Pattern Recognition
Intelligence Hub was built from first principles to solve the scale, context, and pattern recognition challenges that professional investors face when managing 50-200 company portfolios.
Architecture Philosophy: Three Core Capabilities
Core Capability 1: Project-Based Intelligence Organization
Track analytical threads across companies, sectors, and themes with persistent context.
Core Capability 2: Parallel Task Execution at Scale
Submit hundreds of AI-powered analytical tasks simultaneously; get consolidated results in minutes.
Core Capability 3: Temporal Snapshots for Long-Term Tracking
Preserve quarterly and annual analytical context; track how companies, sectors, and themes evolve over time.
Let's explore each capability in depth.
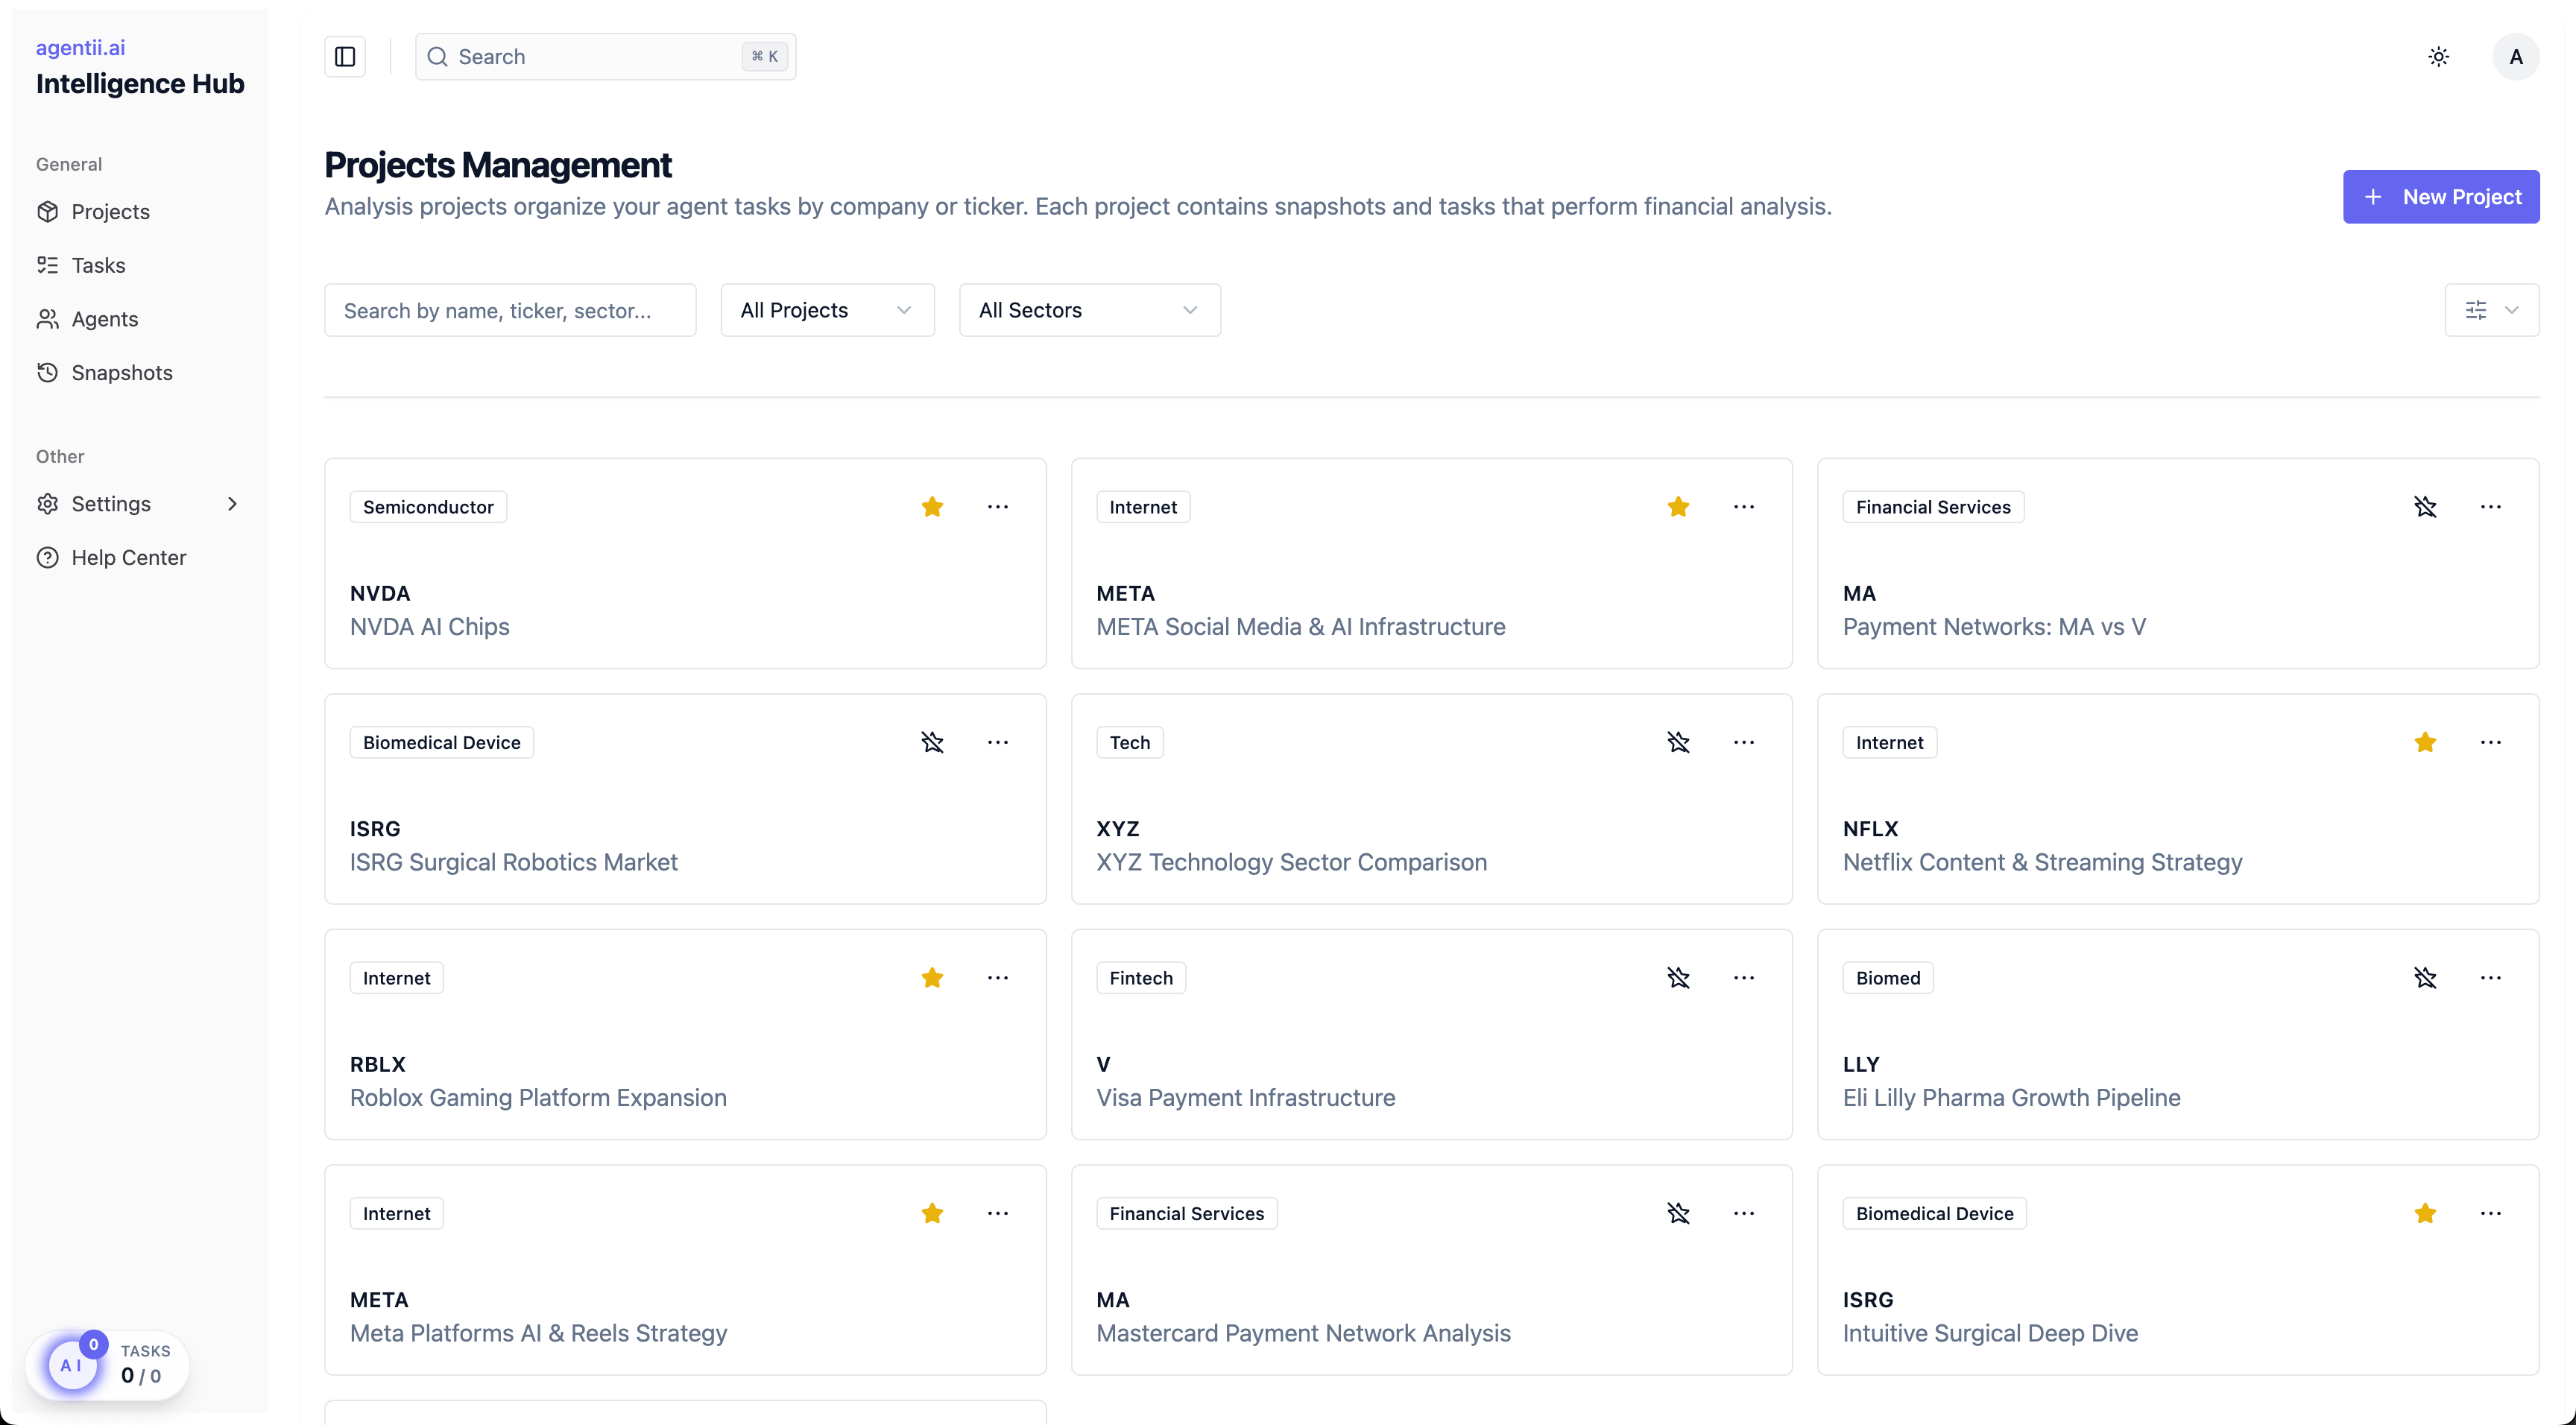
Core Capability 1: Project-Based Intelligence Organization
Professional investment research doesn't happen in isolation—it's organized around analytical projects: sector coverage, thematic research, event-driven catalysts, portfolio reviews.
The Problem with Generic AI: No Analytical Continuity
When you ask ChatGPT "Analyze Apple's competitive positioning," the AI:
- Retrieves relevant data
- Generates an analysis
- Discards all context when the conversation ends
Next week, when you ask "How has Apple's competitive positioning evolved?", ChatGPT:
- Starts from scratch
- Retrieves data again
- Has no memory of prior analysis
Result: You're manually tracking analytical continuity across disconnected conversations.
Intelligence Hub Solution: Project-Centric Research Organization
Intelligence Hub organizes all research around Projects—persistent analytical containers that preserve context across time, companies, and research threads.
How Projects Work in Intelligence Hub
1. Create a Project
Define the research container: a primary ticker, related tickers, and a lookback window the system should use by default.
Example:
- Project Name: "Workday SaaS Elongated Sales Cycles Analysis"
- Primary Ticker: WDAY
- Related Tickers: CRM, SNOW
- Lookback: Last 12 fiscal quarters
2. Create a Snapshot (a point-in-time research pass)
A Snapshot groups a set of Tasks you run together (for example, “Post-earnings Q3 2025”). This is how you track how conclusions change over time.
3. Define Tasks (agent jobs)
In Intelligence Hub, a Task is a concrete job for an agent to complete (prompt + agent settings). In the backend, each Task maps 1:1 to a Session, and a Session may take one or multiple agent runs to finish.
4. Run Tasks in parallel and compare results
Start the Tasks and let the system execute them in parallel (queued → in progress → done), then review results side-by-side across companies and across Snapshots.
Intelligence Hub remembers prior analyses through Projects and Snapshots, enabling cumulative reasoning that generic chatbots can’t support.
Pre-Built Analytical Workflows (100+ Templates)
Intelligence Hub ships with pre-built agents you can run as Tasks. Each one is a reusable workflow (prompt + tools + output format) designed for institutional research.
Quality Analysis
- Business Model Classifier: Classifies business models as Product, Service, Platform, or Hybrid using earnings calls
- Market Positioning Analyzer: Determines market positioning using ASP, ARPU, and margin analysis
Competition Analysis
- Direct Competitor Identifier: Identifies major competitors by development stage across product lines
- Market Share Tracker: Tracks operating metrics and competitive positioning changes
Growth Analysis
- Growth Classification Engine: Classifies growth strategy as Organic, Inorganic, or Mixed
- M&A Activity Tracker: Tracks inorganic growth through M&A and strategic investments
Transformation Analysis
- AI Trend Exposure Evaluator: Assesses AI trend exposure and classifies as Enabler, Adopter, or Disrupted
- EV & Clean Tech Assessor: Evaluates electric vehicle and clean technology trend positioning
Turnaround Analysis
- Stagnation Detection System: Detects revenue and earnings stagnation patterns using quarterly analysis
- Growth Catalyst Identifier: Identifies new product launches and growth catalysts for turnaround
Risk Factors Analysis
- Comprehensive Risk Evaluator: Identifies and rates risk categories with impact assessment
- Regulatory & Compliance Monitor: Tracks regulatory changes and compliance risks across jurisdictions
Financial Forecasts and Outlook Analysis
- Sentiment Classification Engine: Classifies analyst sentiment as Highly Convicted, Positive, or Negative
- Earnings Estimate Synthesizer: Synthesizes forward estimates for Revenue, EPS, EBITDA across institutions
Valuation Analysis
- Multiple Valuation Calculator: Calculates relative valuation multiples across peer comparisons
- DCF Modeling Engine: Builds DCF models with WACC calculation and sensitivity analysis
The point isn’t one perfect prompt—it’s having a library of repeatable agents you can run across one company or 100+ companies, then compare results across Projects and Snapshots.
Core Capability 2: Parallel Task Execution at Scale
During earnings season, time-sensitive macro events, or sector rotations, professional investors need to analyze dozens or hundreds of companies simultaneously—not sequentially.
The Problem: Sequential Analysis Bottlenecks
Scenario: Earnings Season Week 1
50 companies in your portfolio report earnings within 5 business days. Traditional analysis workflow:
- Read 10-Q filing (30 minutes)
- Listen to earnings call (60 minutes)
- Extract key metrics (15 minutes)
- Update financial model (45 minutes)
- Write investment memo (30 minutes)
Total: 3 hours per company × 50 companies = 150 hours
Even working 16-hour days, you can only analyze 20-25 companies before the window closes.
What Gets Missed:
- The remaining 25-30 companies get superficial coverage
- Cross-company patterns emerge too late to act
- Systematic sector trends are invisible until week 2-3
Generic AI Doesn't Solve This
Asking ChatGPT to "Analyze all 50 earnings calls" doesn't work:
- Context window limits: Can't fit 50 transcripts into one prompt
- No parallelization: It is impossible to run and manage 50+ conversations with ChatGPT or any other generic AI
- No result aggregation: Even if you submit 50 separate queries, manually compiling results takes hours
Intelligence Hub Solution: Parallel Task Execution Engine
Intelligence Hub's Tasks Manager enables you to:
- Setup and Submit hundreds of analytical tasks simultaneously
- Execute tasks in parallel using distributed AI agents
- Consolidate results into unified workspace and reports
Task Manager Features
Batch Task Submission:
- Setup task ensembles
- Apply analytical templates
- Batch submit tasks
Task Monitoring:
- Real-time progress tracking (15/50 tasks complete)
- Retry failed tasks automatically
Result Export:
- Download results as CSV files
- Export dashboards
- Download workspace folders
Task Snapshots:
- Preserve all task results for historical comparison
- Re-run tasks with updated parameters
- Track how analytical snapshots evolved over time
Core Capability 3: Temporal Snapshots for Long-Term Tracking
Investment analysis isn't static—it's cumulative and temporal. Understanding a company's Q3 2025 performance requires context from Q2 2025, Q1 2025, Q4 2024, and prior years.
The Problem: Generic AI Has No Memory
Scenario: Tracking Apple's Margin Evolution
Q2 2025: Ask ChatGPT "What is Apple's gross margin?"
- Answer: "Apple's Q2 2025 gross margin is 45.2%"
Q3 2025: Ask ChatGPT "What is Apple's gross margin?"
- Answer: "Apple's Q3 2025 gross margin is 46.3%"
Q4 2025: Ask ChatGPT "How has Apple's gross margin evolved over the past year?"
- Answer: ChatGPT retrieves Q4 2024, Q1 2025, Q2 2025, Q3 2025 data and calculates trend
- Problem: No preserved context from prior analyses; recalculates every time
Why This Fails:
Professional analysts build cumulative understanding:
- Q2 2025: Noticed margin improvement vs. Q1 2025 → Investigated driver (product mix shift)
- Q3 2025: Margin improved further → Validated that mix shift is persistent
- Q4 2025: Margin stable → Concluded mix shift benefit has plateaued
This analytical narrative is lost when each query starts from scratch.
Intelligence Hub Solution: Temporal Snapshots
Snapshots are point-in-time analytical records that preserve:
- Financial metrics (revenue, margins, cash flow, etc.)
- Qualitative assessments (management commentary, competitive positioning, risk factors)
- Analytical conclusions (investment thesis, conviction level, price target)
- Context and reasoning (why you reached these conclusions)
How Snapshots Work
Example: Tracking Apple Across Quarters
Q2 2025 Snapshot (Created May 2025):
Financial Metrics:
- Revenue: $90.8B (YoY: +4.8%)
- Gross Margin: 45.2% (vs. Q1 2025: 44.8%)
- Operating Margin: 29.5%
- EPS: $1.53
Qualitative Assessment:
- Revenue Drivers: iPhone flat, Services +12% YoY (App Store + cloud strength)
- Margin Drivers: Mix shift toward Services driving gross margin expansion
- Management Tone: Optimistic on Services sustainability; cautious on iPhone upgrade cycle
- Competitive Positioning: Strong vs. Samsung (share gains in premium segment)
Analytical Conclusion:
- Thesis: Services mix shift is structural, not cyclical → Margin expansion sustainable
- Conviction: 7/10 (moderate-high)
- Price Target: $185 (vs. current $175)
Q3 2025 Snapshot (Created August 2025):
Financial Metrics:
- Revenue: $85.8B (YoY: +5.2%)
- Gross Margin: 46.3% (vs. Q2 2025: 45.2%) ← 110 bps QoQ improvement
- Operating Margin: 30.1%
- EPS: $1.46
Qualitative Assessment:
- Revenue Drivers: iPhone +2% (better than expected), Services +14% YoY (accelerating)
- Margin Drivers: Services mix + lower component costs (NAND, DRAM pricing down)
- Management Tone: Increased confidence on Services growth sustainability
- Competitive Positioning: Gaining share vs. Android in Asia-Pacific
Analytical Conclusion:
- Thesis Validation: Services mix shift confirmed; additional tailwind from component costs
- Conviction: 8/10 (high) ← Increased from 7/10
- Price Target: $195 (vs. prior $185) ← Raised by $10
Q4 2025 Snapshot (Created November 2025):
Financial Metrics:
- Revenue: $89.5B (YoY: +6.1%)
- Gross Margin: 46.1% (vs. Q3 2025: 46.3%) ← Stable QoQ
- Operating Margin: 30.0%
- EPS: $1.64
Qualitative Assessment:
- Revenue Drivers: iPhone +5% (iPhone 17 cycle stronger than expected), Services +13% YoY
- Margin Drivers: Gross margin stable; Services mix offset by component cost normalization
- Management Tone: Cautious on macro headwinds; confident on long-term Services trajectory
- Competitive Positioning: Maintaining premium positioning; no significant competitive threats
Analytical Conclusion:
- Thesis Update: Services mix benefit plateauing; iPhone upgrade cycle providing new growth driver
- Conviction: 7/10 (moderate-high) ← Lowered from 8/10 (margin expansion stalling)
- Price Target: $190 (vs. prior $195) ← Lowered by $5 (margin upside limited)
Snapshot Benefits: Cumulative Intelligence
1. Track Thesis Evolution Over Time
Compare Q2 2025 → Q3 2025 → Q4 2025 snapshots to see how your understanding evolved:
- Q2: Thesis = Services mix shift drives margin expansion
- Q3: Thesis validated + additional tailwind from component costs
- Q4: Thesis refined: Mix benefit plateauing, iPhone cycle becoming more important
2. Identify Analytical Turning Points
Snapshots flag when key metrics or assessments change:
- Margin Inflection (Q3 2025): Gross margin jumped 110 bps QoQ → Investigate driver
- Conviction Change (Q3 → Q4): Conviction dropped from 8/10 to 7/10 → Margin expansion stalling
3. Preserve Reasoning and Context
Each snapshot includes why you reached conclusions:
- Q2: "Mix shift toward Services driving gross margin expansion" ← Hypothesis
- Q3: "Services mix + lower component costs" ← Hypothesis validated + new driver identified
- Q4: "Services mix offset by component cost normalization" ← Hypothesis refined
This preserved reasoning prevents you from forgetting why you made prior assessments.
Intelligence Hub is Built on Institutional-Grade Infrastructure
Intelligence Hub isn't a standalone tool—it's built on the same institutional data sources and 99% accurate agentic search that power Agent Workbench.
Institutional Data Sources
(For full details, see: Agent Workbench: Professional Investment Research)
Data Coverage:
- SEC Filings: 10-K, 10-Q, 8-K, S-1, DEF-14A for all US public companies
- Earnings Transcripts: Russell 3000 companies, 5+ years history
- Sell-Side Research: 20+ brokerages (consensus estimates, ratings, target prices)
- Expert Networks: Channel checks, supplier intelligence, industry expert interviews
- Proprietary Research: Upload your own meeting notes, field research, internal analysis
Data Architecture:
- Automatic time-stamping: Every data point tagged with publication date, fiscal period, "as of" date
- Entity linking: Canonical company identifiers across all sources (AAPL = Apple Inc. = CIK 0000320193)
- Fuzzy-tolerant retrieval: Understands financial terminology and industry jargon
- Source ranking: Prioritizes authoritative sources (SEC filings > earnings releases > news)
95%+ Accurate Agentic Search
(For full technical details, see: Achieving 99% Accuracy in Financial AI)
Result: 99%+ accuracy on financial question-answering benchmarks (vs. 25-30% for traditional RAG systems).
Who Should Use Intelligence Hub?
Target Users: Professional Investors Managing 50+ Company Portfolios
1. Long/Short Equity Fund Analysts
- Covering 50-80 companies per sector
- Conducting quarterly earnings analysis across portfolio
- Identifying relative value opportunities (long candidates vs. short candidates)
- Tracking competitive dynamics and market share shifts
Value Proposition: Reduce earnings season workload from 150 hours to 20 hours. Surface cross-company patterns invisible in sequential analysis.
2. Portfolio Managers and Investment Directors
- Managing multi-sector portfolios (100-200 holdings)
- Making allocation decisions based on sector momentum
- Identifying thematic investment opportunities (AI, ESG, demographic trends)
- Monitoring portfolio holdings for risk and opportunity
Value Proposition: Get consolidated portfolio insights in minutes, not days. Track 100+ companies with same rigor previously reserved for top 20 holdings.
3. Sector Research Analysts
- Covering entire sectors (Technology, Healthcare, Industrials, Financials)
- Publishing sector reports and thematic research
- Tracking industry trends, competitive dynamics, regulatory developments
- Providing sector allocation recommendations to portfolio managers
Value Proposition: Execute sector-wide analyses in minutes. Identify sector rotation signals before they're priced in.
4. Multi-Strategy Fund Analysts
- Managing event-driven, relative value, and long/short strategies simultaneously
- Screening 500+ stock universe for opportunities
- Running thematic screens (M&A targets, dividend sustainability, ESG leaders)
- Tracking macro themes across asset classes
Value Proposition: Run parallel screens across 500-stock universe in 15 minutes. Track thematic baskets with quarterly snapshots.
Getting Started: Try Intelligence Hub Today
Request an Invitation Code
Want to see Intelligence Hub in action with your portfolio?
Request an invitation code:
- Visit www.agentii.ai/request
- Fill out request form (name, email, firm, portfolio size, use case)
- Our team will reach out within 1 business day
What to expect:
- Live walkthrough of Intelligence Hub features
- Customized demo using your portfolio holdings
- Real analytical workflows from your investment process
- Q&A on data sources, accuracy, and pricing
Key Takeaways
1. Portfolio management breaks traditional research tools due to scale (100+ companies), time pressure (earnings season = 3 weeks, minutes after earnings = 15 minutes), and pattern recognition needs (cross-company insights invisible in sequential analysis).
2. Generic AI chatbots fail portfolio-scale research due to no temporal context (each query starts fresh), no cross-company synthesis (can't maintain comparative context), and no parallel execution (sequential processing bottleneck).
3. Intelligence Hub solves scale through three core capabilities:
- Project-Based Organization: Preserve analytical context across companies, quarters, and themes
- Parallel Task Execution: Submit hundreds of analytical tasks simultaneously; get consolidated results in minutes
- Temporal Snapshots: Track how companies, sectors, and themes evolve over quarters and years
4. Intelligence Hub is built on institutional infrastructure: Same data sources (SEC filings, earnings transcripts, sell-side research) and 95%+ accurate agentic search that power Agent Workbench.
5. Intelligence Hub is for professional investors managing 50-200 company portfolios: long/short equity analysts, portfolio managers, sector research analysts, multi-strategy fund teams.
Conclusion: The Future of Portfolio Management is AI-Native
For decades, professional investors have faced an impossible choice: depth or breadth. You could either:
- Analyze 20-30 companies with institutional rigor (deep coverage, limited portfolio)
- Track 100-200 companies superficially (broad coverage, shallow analysis)
You couldn't do both.
Intelligence Hub breaks this trade-off.
By combining institutional-grade data sources, 99%+ accurate agentic search, parallel task execution, and temporal snapshot tracking, Intelligence Hub enables professional investors to analyze 100+ companies with the same analytical rigor previously reserved for top 20 holdings.
This isn't about replacing human judgment—it's about amplifying pattern recognition at portfolio scale. Surface cross-company trends invisible in sequential analysis. Track 100+ companies with quarterly snapshots. Execute sector-wide analyses during time-sensitive windows.
The future of portfolio management isn't generic chatbots answering one-off questions. It's AI-native intelligence platforms that preserve context, recognize patterns, and operate at the scale professional investors demand.
Ready to transform your portfolio management workflow?
- Try Intelligence Hub: www.agentii.ai/hub
- Request invitation code: www.agentii.ai/request
- Questions? Email us at sales@agentii.ai
About the Author
Frank Agentii is Co-founder of Agentii, a company building production-ready agentic AI systems for institutional investors. Before Agentii, he spent years working on AI systems for large public companies and quantitative trading firms, specializing in multi-agent orchestration, retrieval systems, and ensuring AI reliability for high-stakes financial applications.
Further Reading
- Agent Workbench: Professional Investment Research Powered by Agentic AI - Deep-dive research for single companies
- Achieving 99% Accuracy in Financial AI: Why Agentii Chose Agentic Search Over RAG - Technical architecture deep-dive
- Agentii Platform Overview - Product features, pricing, and customer stories
Disclaimer: This blog post is for informational and educational purposes only. It does not constitute investment advice, financial advice, or a recommendation to buy or sell any securities. Past performance is not indicative of future results. Investors should conduct their own due diligence and consult with qualified financial advisors before making investment decisions.